XaasIO MLT runs alongside the other management services. Suitable for medium-sized enterprise deployments.
XaasIO MLT · Monitoring, Logging and Telemetry Service
Open-Source Observability, Made Simple
Give operations teams one place for metrics, synthetic checks, alerts, logs and traces across data centers, private clouds, Kubernetes and network devices. Run the service on your own infrastructure, while retaining control of your operational data, identity, retention and operations.
Prometheus, Grafana, OpenSearch and OpenTelemetry by default. Upstream-aligned. Customer-operated, co-managed or fully managed by XaasIO.
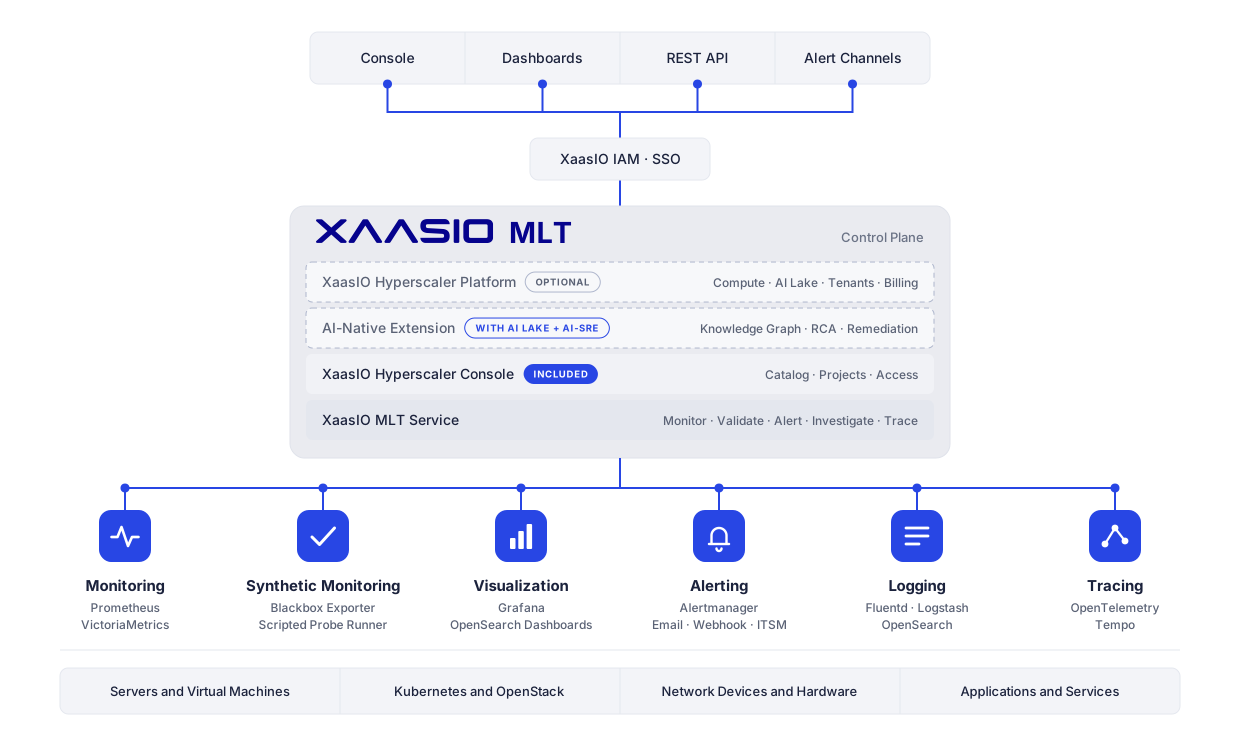
Observability, simplified
Everything Needed to Deliver Observability as a Service
Teams onboard the systems they run. XaasIO MLT coordinates metrics, synthetic checks, alerting, logging and tracing behind the scenes.
Core components
Infrastructure and Workload Monitoring | Collect, retain and query operational metrics from infrastructure, platforms and workloads. Technical reference: Prometheus · VictoriaMetrics |
Synthetic Monitoring | Perform scheduled endpoint, API, DNS, TCP, TLS and approved functional service checks. Technical reference: Prometheus Blackbox Exporter · Scripted Synthetic Probe Runner |
Visualization | Present role-relevant dashboards for infrastructure, workloads, synthetic checks, logging and telemetry. Technical reference: Grafana · OpenSearch Dashboards |
Alerting | Route real-time notifications through email, webhook and ITSM channels. Technical reference: Alertmanager |
Logging | Forward, parse, index, search and analyze centralized log data. Technical reference: Fluentd · Logstash · OpenSearch |
Tracing | Capture and visualize distributed request traces across application services. Technical reference: OpenTelemetry · Tempo |
Use the same service through the:
Six domains
Purpose-Built Open-Source Components.
One Operating Model.
Each domain uses the open-source component that is best at the job. XaasIO MLT connects them, so teams work from one console, one identity and one operational view.
Infrastructure and Workload Monitoring
Collect, retain and query operational metrics.
Host exporters
SNMP, IPMI exporters
Platform metrics
Prometheuscollect, evaluate rules
VictoriaMetrics store
Grafana dashboards
Alertmanager
Prometheus collects metrics and evaluates rules, then remote-writes the long-term stream to VictoriaMetrics for storage and query.
Role
Prometheus collects metrics and evaluates rules. VictoriaMetrics is the long-term metrics store for trends, capacity and historical queries.
Covers
Operating systems, virtualization and cloud platforms, Kubernetes, storage, network devices and hardware health.
Collection
Prometheus-compatible exporters matched to each target: host and hypervisor exporters, SNMP for network devices and IPMI for hardware.
Technical reference
Prometheus · VictoriaMetrics · Exporters · Remote Write
Synthetic Monitoring
Test services from the outside, before users report a problem.
HTTP and API checks
DNS, TCP and TLS
Service journeys
Synthetic ProbesBlackbox and scripted
Availability
Latency, TLS expiry
Prometheus metrics
Scheduled probes test services from the outside. Functional checks use controlled test accounts and non-destructive test data.
Role
Scheduled probes validate the availability, responsiveness and basic functional health of agreed endpoints, APIs and service journeys.
Covers
HTTP and HTTPS status and response time, DNS resolution, TCP connectivity, TLS certificate validity, API checks and approved functional steps.
Safeguards
Functional checks use controlled test accounts and non-destructive test data. Synthetic monitoring complements application telemetry; it does not replace it.
Technical reference
Prometheus Blackbox Exporter · Scripted Synthetic Probe Runner
Visualization
Role-relevant dashboards for every signal.
Metrics
Logs
Traces
GrafanaOpenSearch Dashboards
Infrastructure views
Workload views
Logs and traces
Role-relevant dashboards for infrastructure, workloads, synthetic checks, logging and telemetry, with permissions by team.
Role
Grafana is the primary view for monitoring, synthetic status, telemetry and traces. OpenSearch Dashboards is the interface for log search and investigation.
Covers
Infrastructure, workloads, synthetic checks, logging and telemetry, organized in folders with permissions by team.
Technical reference
Grafana · OpenSearch Dashboards
Alerting
Actionable notifications, routed to the people who can act.
Metric alert rules
Probe failures
Platform health rules
Alertmanagergroup, route, silence
Email
Webhook
ITSM tickets
Related alerts are grouped and de-duplicated, then routed
by team, severity and schedule.
Role
Alertmanager groups, de-duplicates and routes the alerts raised by metric rules and synthetic checks.
Channels
Email, webhook and ITSM, routed by team, severity and schedule.
Technical reference
Alertmanager · Prometheus Alert Rules
Logging
Centralized log data, from forwarding to investigation.
Fluentd forwarders
Logstash pipelines
Syslog and app logs
OpenSearchindex and retain
Search and filter
Investigation
Dashboards
Fluentd forwards; Logstash ingests, enriches and parses; OpenSearch indexes and retains; OpenSearch Dashboards presents.
Role
Fluentd forwards logs from platforms and applications. Logstash ingests, enriches and parses them. OpenSearch indexes and retains them. OpenSearch Dashboards presents them.
Covers
System, application, audit and platform logs, structured or unstructured.
Technical reference
Fluentd · Logstash · OpenSearch · OpenSearch Dashboards
Tracing
Follow a request across services to find latency and dependencies.
Application services
OpenTelemetry SDKs
Collector pipeline
Tempotrace storage
Request traces
Service dependencies
Latency analysis
OpenTelemetry carries traces from application services. Tempo stores
them, and Grafana shows each request end to end.
Role
OpenTelemetry captures distributed traces from application services. Tempo stores them, and Grafana shows each request end to end.
Covers
APIs, microservices and back-end calls behind a single transaction.
Technical reference
OpenTelemetry · Tempo · Grafana
How it works
One Workflow. Every Signal in One Place.
01
Monitor
Metrics show the health and capacity of infrastructure and workloads.
02
Validate
Synthetic checks test agreed endpoints, APIs and service journeys on a schedule.
03
Alert
Alertmanager groups meaningful conditions and routes them by email, webhook, and ITSM.
04
Investigate
Centralized logs are searched and filtered to find what happened.
05
Trace
Distributed traces follow the request across services to show latency and dependencies.
Teams onboard a system once. XaasIO MLT keeps metrics, checks, alerts, logs and traces in one operational view.
Advanced Capabilities
Enterprise Observability, Presented as Simple Choices
Full-Stack Coverage
Monitor operating systems, virtualization, OpenStack, Kubernetes, databases, storage, network devices, and hardware with exporters matched to each target.
Technical reference: Host and Hypervisor Exporters · SNMP · IPMI · Kubernetes Service Discovery
Cross-Signal Correlation
Correlate a failed probe or an alert with the metrics, logs and traces for the same service and time range.
Technical reference: Grafana · Shared Service Labels · OpenTelemetry
Governed Synthetic Transactions
Run approved functional checks with controlled test accounts and non-destructive test data, on a defined schedule and scope.
Technical reference: Scripted Synthetic Probe Runner · Controlled Service Accounts
Role-Based Dashboards
Give executives, operations centers, platform teams and application owners their own views of service health, service levels, capacity and incident trends.
Technical reference: Grafana · OpenSearch Dashboards
Retention and Audit Evidence
Keep long-term metrics and logs under retention policies, and archive logs, reports and dashboard snapshots as audit evidence in object storage.
Technical reference: VictoriaMetrics Retention · OpenSearch Index State Management · S3-Compatible Object Storage
Multi-Site and Edge Collection
Use local collectors, probes and buffering at branch, edge and recovery sites, with secure forwarding to the central platform.
Technical reference: Local Collectors · Remote Write · Secure Forwarding
Deployment models
Management Cluster
Dedicated Observability Cluster
Separate zones for metrics, logs, and operations tooling. Recommended for large enterprises and regulated environments.
Multi-Site Deployment
A central platform, a standby at the recovery site, and local collectors at branch and edge sites. Suitable for distributed or sovereign environments.
Advanced capabilities depend on the validated sources, exporters, storage and architecture selected for each deployment.
Production observability
Open-Source Monitoring Without the Integration Burden
XaasIO designs, deploys, validates and supports XaasIO MLT as one production service rather than an unsupported collection of tools, plugins and scripts.
Validated Architecture
Exporters, collectors, storage, identity, dashboards and alert routing are tested as a complete solution.
Controlled Lifecycle
Components, exporters, and dashboards follow a documented release, patching, and upgrade policy based on validated upstream releases.
Sovereign and Air-Gapped Ready
Operational data, logs and audit evidence stay inside your boundary, with local repositories, identity and controlled update procedures.
Flexible Operating Model
Choose customer-operated, co-managed, fully managed or dedicated SRE Pod operations.
Built for enterprise private cloud, sovereign and regulated cloud, and cloud service provider or MSP environments.
AI-Native extension
Add AI Reasoning and a Knowledge Graph to Your Operational Data
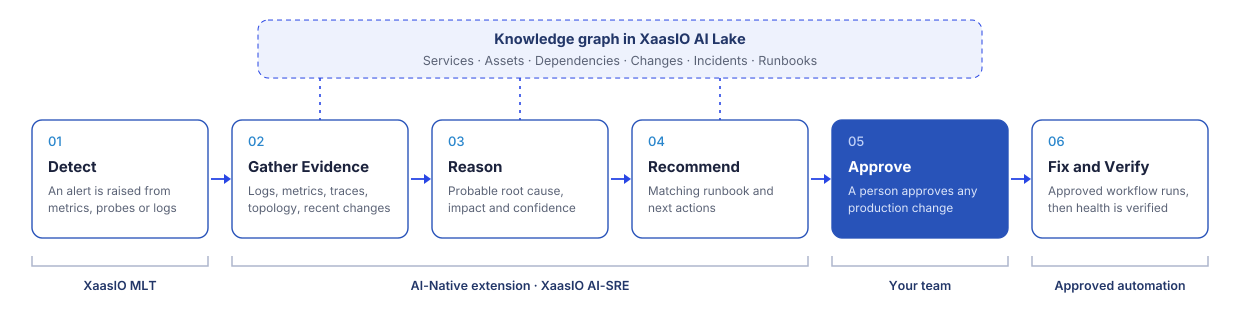
XaasIO MLT collects and presents the signals. When XaasIO AI Lake and XaasIO AI-SRE are part of the deployment, an AI-Native extension adds a knowledge graph and a reasoning layer on top of the same monitoring, logging and telemetry data.
RequiresXaasIO AI Lake and XaasIO AI-SRE
A Knowledge Graph of Your Estate
Links services, assets, dependencies, recent changes, incidents and runbooks, so reasoning starts from topology and history instead of isolated alerts.
Technical reference: XaasIO AI Lake · Inventory and CMDB · Runbooks and SOPs
Alert Correlation and Triage
Groups related alerts by service impact, suppresses duplicate noise where appropriate, and highlights affected services and owners.
Technical reference: Incident Triage Agent · Service Dependencies
Root-Cause Analysis with Evidence
Proposes a probable root cause with the metrics, logs, traces and recent changes that support it, and a confidence level.
Technical reference: RCA Agent · LangGraph · LlamaIndex · OpenSearch Vector Search
Runbook and Solution Recommendation
Matches the incident to runbooks, standard procedures and previous root-cause reports, and recommends the next actions.
Technical reference: Knowledge and RAG Layer · Remediation Planning Agent
Governed Remediation
Runs approved workflows only after a person approves production or security-sensitive changes, then checks metrics, logs and service health.
Technical reference: Approval Workflow · Ansible AWX · Argo Workflows and Events
Incident Summaries and Audit Evidence
Drafts post-incident reports, updates the ticket, and packages evidence such as change history, approval records and remediation status.
Technical reference: Compliance Evidence Agent · ChatOps Agent · Evidence Archive
The AI-Native extension assists operations teams. It does not replace change control: recommendations carry their evidence, and production changes wait for approval.
What an answer looks like
Evidence First. Approval Before Action.
Example output
Probable root cause
Application API latency is likely caused by database connection pool saturation.
Evidence
- Metrics show an API latency increase from 10:15 AM.
- Logs show repeated database timeout errors.
- A recent configuration change modified connection parameters.
- No compute or memory pressure was observed on the application nodes.
Recommended action
- Validate database cluster health.
- Check application connection pool settings.
- Review the recent configuration change, and roll it back if required.
- Restart the application service only after operational approval.
Governed by Design
- Role-based access for users, teams and AI agents
- Mandatory human approval for production remediation
- Every AI recommendation and automated action is logged
- AI agents can call only approved tools and workflows
- Secrets and sensitive fields are masked in logs and prompts
- Approved AI models, prompts and policy controls
- Compliance evidence kept in a secure long-term archive
Console included, extensions optional
Start with Monitoring. Add AI and more Cloud services when you need them.
The default XaasIO MLT edition includes the XaasIO Hyperscaler console for monitoring services. The AI-Native extension needs XaasIO AI Lake and XaasIO AI-SRE. Delivering Compute, AI Lake and other XaasIO modules through the same console needs the XaasIO Hyperscaler Platform.
Included
Included with XaasIO MLT
- XaasIO Hyperscaler console for monitoring services
- Monitoring, synthetic checks, alerting, logging and tracing
- Grafana and OpenSearch Dashboards
- Projects, roles and single sign-on
- REST API and alert webhooks
Optional
Requires XaasIO AI Lake and XaasIO AI‑SRE
- AI-Native extension for XaasIO MLT
- Knowledge graph of services, assets and changes
- AI-assisted triage and root-cause analysis
- Governed remediation with human approval
Optional
Requires XaasIO Hyperscaler Platform
- Additional XaasIO modules in the same console
- Multi-service catalogs and tenant management
- FinOps, metering, billing and payments
Modules delivered through XaasIO Hyperscaler Platform
XaasIO Compute
OpenStack private cloud for virtual machines, networks, and persistent storage.
XaasIO RDS
Managed PostgreSQL, MySQL, MariaDB and MongoDB on infrastructure you control.
XaasIO AI Lake
Governed data lake, lakehouse, enterprise context, and knowledge foundation.
XaasIO AI Factory + HPC
Accelerated AI, scientific computing, engineering and High-Performance Computing workloads.
XaasIO AI Token Factory
Governed and metered AI inference delivered through standardized APIs.
These modules are optional and are not required to deploy or operate XaasIO MLT. Adding them to the console requires the XaasIO Hyperscaler Platform.
Monitoring Migration Support Packs
Separately scoped support for assessment, migration, integration and managed operations – available for:
Existing Nagios and Zabbix estates
Prometheus and Grafana stacks
Elastic, Splunk and other log platforms
SaaS observability platforms
Software supply chain assurance
Every supported XaasIO MLT release includes an upstream SBOM and XaasIO release SBOM, covering components, container images, dependencies, licenses, vulnerabilities, provenance, and signed artifacts. SPDX or CycloneDX outputs support SOC 2-aligned controls and audit evidence.
Upstream SBOM
XaasIO release SBOM
Components and container images
Licenses and vulnerabilities
Provenance and signed artifacts
SPDX or CycloneDX output
SOC 2-aligned audit evidence
Existing tables, pipelines, indexes and prompts are reviewed for reuse
SPDX and CycloneDX outputs are available for every supported release
Frequently asked questions
What is XaasIO MLT?
XaasIO MLT is a monitoring, logging and telemetry service built on Prometheus, VictoriaMetrics, Grafana, OpenSearch and OpenTelemetry. It runs on your own infrastructure and gives operations teams metrics, synthetic checks, alerts, logs and traces through one console, with XaasIO designing, validating and supporting it as a single service.
Which open-source components does XaasIO MLT use?
Prometheus and VictoriaMetrics for metrics, the Prometheus Blackbox Exporter and a scripted probe runner for synthetic checks, Grafana and OpenSearch Dashboards for visualization, Alertmanager for alert routing, Fluentd, Logstash and OpenSearch for logging, and OpenTelemetry with Tempo for tracing.
What does synthetic monitoring check?
Scheduled probes test agreed endpoints and APIs for reachability, response time, HTTP status, DNS resolution, TCP connectivity and TLS certificate validity, plus approved functional checks that use controlled test accounts and non-destructive test data. It complements application telemetry and does not replace it.
Can XaasIO MLT take over from Nagios or Zabbix?
Yes, as a planned migration. XaasIO MLT standardizes on Prometheus-based monitoring, with exporters for operating systems, virtualization, network devices over SNMP and hardware over IPMI. Existing checks, templates and alert rules are reviewed during migration planning and rebuilt as exporters, synthetic checks and alert rules.
What is the AI-Native extension?
An optional layer that adds a knowledge graph and AI reasoning to the monitoring, logging and telemetry data: alert correlation, probable root cause with evidence, runbook recommendations and governed remediation. It is available when XaasIO AI Lake and XaasIO AI-SRE are part of the deployment.
Does the AI change production systems on its own?
No. Production and security-sensitive changes require human approval. AI agents can call only approved tools and workflows, and every recommendation and automated action is logged.
Is XaasIO MLT an alternative to SaaS observability platforms?
XaasIO MLT covers the same monitoring, logging, tracing and dashboard needs on infrastructure you control, using open-source components. It is not a drop-in replacement for a specific vendor’s agents or query language, so migration planning covers collectors, dashboards, alert rules and retention.
Where does XaasIO MLT run?
In your data center, private cloud or cloud account, as a management-cluster deployment, a dedicated observability cluster, or a multi-site deployment with local collectors at branch and edge sites.
Can XaasIO MLT operate in an air-gapped environment?
Yes. XaasIO MLT can be designed with local repositories, identity, storage and controlled update procedures, so operational data, logs and audit evidence stay inside the approved security boundary.
Is the XaasIO Hyperscaler console included?
Yes. The default XaasIO MLT edition includes the XaasIO Hyperscaler console for monitoring services. Extending the console to other XaasIO modules, such as XaasIO Compute or XaasIO AI Lake, requires the XaasIO Hyperscaler Platform.
Are other XaasIO modules required?
No. XaasIO MLT can operate independently. The AI-Native extension requires XaasIO AI Lake and XaasIO AI-SRE, and adding other modules to the console requires the XaasIO Hyperscaler Platform.
Who operates the platform?
You choose the operating model. XaasIO MLT can be customer-operated, co-managed, fully managed by XaasIO or run by a dedicated SRE Pod.
Prometheus, VictoriaMetrics, Grafana, Tempo, OpenSearch, OpenTelemetry, Fluentd, Logstash, Kubernetes, OpenStack, Nagios, Zabbix, Elastic, Splunk and other product names are trademarks of their respective owners and are named for identification only. XaasIO is not affiliated with, endorsed by or sponsored by these organizations.
Build what the world depends on.
Planning a cloud for government, financial services, pharmaceuticals, healthcare, energy, transport, industry, service-provider operations, or private AI? Work with XaasIO to define the architecture, security boundary, and operating model your environment requires.